
Introduction to Data Management (Part 1): Getting to Know Your Data Format

Foreword
This article provides information on basic data management for people with little or no knowledge on it but have the following needs:
1. Managing and organizing data so as to turn them into meaningful reports which can be reused at any time without reconstructing them into a new set of data.
For example:
(a) You have a sales order data at hand. You'd like to automatically generate monthly reports, calculating monthly revenue from it while investigating the best-selling products.
(b) You have a sales and inventory data at hand. You'd like to automatically update inventory records when there's an increase or decrease in the number of the goods.
(c) You have a customer relationship data at hand. You'd like to simultaneously record customer data in a set of contacts while investigating customer types and tracking their most frequently asked questions.
2. You are planning to conduct a pivot analysis or create a chart which highlights the significance of a data in Excel or Ragic, but are uncertain of the way to properly structure the tables, divide the cells, put certain infromation in order, or change its format to produce the desired results.
If you're stuck in either of the above circumstances, start by asking yourself these questions to determine what you could do to improve the situation:
What is the type of my tables?
What format should it be framed into so that I can efficiently analyze and manage it with data management/ processing tools based on my current workflow?
For non-progammers or people less experienced in data management, the most starightforward approach to organize a bulk, messy data is to compile and store them in tables and spreadsheets such as Excel, Google sheet, or Ragic (Listing page).
The well-known benefits of storing data into tables and spreadsheets are:
- The neat, structured data appearance achieved through horizontal and vertical framing and element categorization.
- Simple, easier data filtering, sorting, and calculation while giving you the space and convenience to conduct more complex data analysis.
If you have experience using other data management tools with “no coding required/ non-IT background user friendly” interface other than Ragic, you may find that most of them adopt data organization principle in the form of tables/ forms/ spreadsheets.
Nevertheless, it is important to know that a successful data organization requires proactive actions- meaning that no sort of data organization will happen “magically” by deliberately stuffing data into the system, even if you're using the world’s most cutting-edge data management tool.
In our support team’s experience, one of the most frequently encountered issue is data format incompatibility. If your data format isn’t within the system’s processing mechanism range (or maybe you’re ignorant of the fact that your data is incompatible), yet you still insist to import everything at once, then there’s a high possibility that you would be facing unexpected data mapping errors.
Stuffing too many data at once may also hinder you from finding the suitable format to organize your data, as well as the inability to proceed with further data management such as generating reports, or conducting more advanced analysis.
The required data format differs across data management tools. While many of them support the “universally used” formats which can be applied in or synchronized with other systems, some only support their system’s own format. This article focuses on the "universally used" formats, which will help compile your messy, rigid data into versatile tables.
This article is divided into two parts (1 & 2). You’re currently reading Part 1, which will cover the basic knowledge of data management dos and don’ts, introduction to the basic elements of tables, different table formats, and the plausible relationships between them. Part 2 will provide you tips on organizing your forms/ tables into an easily analyzed format.
Note: For people who already possess the basic knowledge of form design and data organization, you may skip to this part and jump straight to “spreadsheet” and “form” sections.
Basic elements of tables
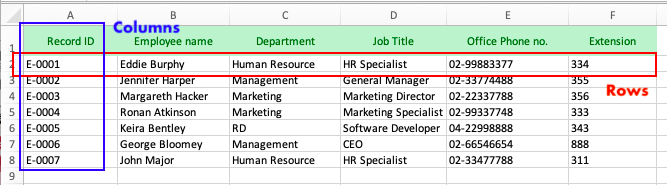
In the table, we call the rectangles lining horizontally “columns” (A, B, C, D,...) and those lining vertically “rows” (1, 2, 3, 4,...). The “coordinate” of the cells in the table is identified by the name of the column and the order of the row it is positioned in. For example we’d like to search for “Keira Bentley” in the table. “Keira Bentley” is situated in the 6th row of B column, and therefore B6 cell is “Keira Bentley”s position in the table.
Different types of tables: spreadsheets, forms, and others.
Although having the same essential elements (columns and rows), tables differ in terms of usage and data organization rationale.
“Spreadsheets” are suitable for saving raw data, the kind of table which allows the computer to conduct more advanced analyis. Spreadsheets are the backbone of most data analysis tools.
“Forms”, on the other hand, are generally used to record and edit the details of a data, which are displayed as a single entry.
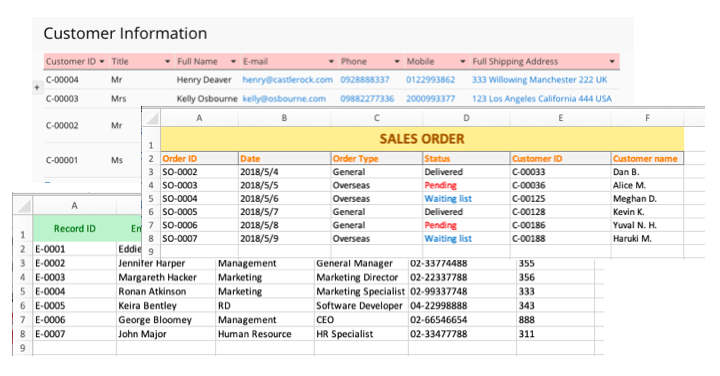
By converting forms into a spreadsheet, the table it generates can be used for pivot analysis, which is yet another type of table displaying data in a whole lot of different nuance (see the example of cross variable tables).
Spreadsheets
Generally used to save raw data, it is regarded as the best format for data analysis. Excel, Google Sheet, Numbers, etc., including Ragic’s listing page, adopted such a format.
If the online forms, data analysis, or data management tools you use support importing or exporting from and to xlsx or CSV files, those tools may as well employ this format genre.
Spreadsheets’ data organization usually allocates the title columns in the first row, where each row includes the same number of columns. Each row under one column records data of the same type, whereas different columns in the same row records different types of data.
Suppose you want to input “Employee HR data” to a spreadsheet.
At large use, description columns are put on the first row of the spreadsheet to indicate the type of information contained under it. Those are called “header row”, as shown below in the field A1 (Record ID), B1(Employee name), C1 (Department), and so on.
In the example, there are 7 sets of data, each of which belongs to one employee. Each set of data contains 6 different information: ID number, name, department, job title, office phone no., and extension.
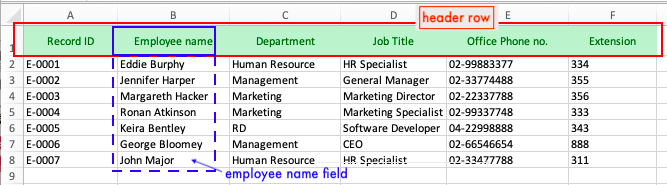
Each column with its header row description is called a field (e. g. B is employee name field). This header row unifies the element of the field values under it: the field value in the third row consistent with the second, the fourth with the third, and so on (see B2 cell "Eddie Burphy", B3 cell "Jennifer Harper", B4 "Margareth Hacker",…etc).
In this sense, the type of each set of the data in the table is categorized horizontally (by the header row), giving you convenience to filter, sort, and sum the field values .
Form
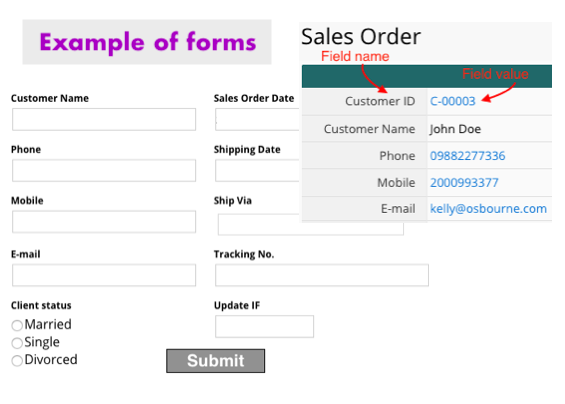
Forms are generally used as an interface for filling out information. When you fill out an application form/online questionnaire, the ”Question” field usually comes with an empty cell which allows you to record your answer (the field value). Therefore, if you’d like to digitalize quotations, purchase requisitions, shipping information, etc., it’s a good practice to convert your data format into an online form format.
Google form, Ragic form page, and other online form platforms are examples of tools which operates in “form” table format. Survey questions and hints in online forms usually function as “field headers”, whereas their corresponding values are what we call the “field values”. One form page contains one entry, and adding a new entry will thus prompt you to a whole new form page.
Since forms are great for inputting entries as spreadsheets are for data analysis, both perfectly match together and are essential in data management. Numerous online form builders support data input from the user interface, from which data can later be combined and exported into spreadsheets. One familiar example is the export of Google forms into Google spreadsheets, or the spreadsheets which list out analytical results of online forms and surveys.
Ragic, on the other hand, blends the two formats where form and spreadsheet display (form and listing page) can be switched back and forth through a click. That is to say, every time a new entry is added to the form (a new form page), it will be stored as a new line of independent data (or entry) on the spreadsheet (the listing page). The field header of Ragic form will be the header of the spreadsheet, and the corresponding field value will therefore appear as the value in the rows of the spreadsheet.
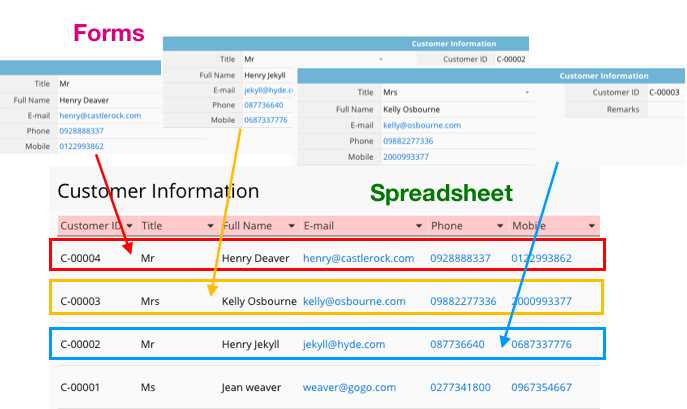
A quick summary: In Ragic, the data displayed on a form page is considered one entry, which makes up one linear data (one row) in the spreadsheet (listing page).
Cross table/ two-variable table or report
As mentioned earlier, different fields in the same row records data of different elements, and that the type of data on the rows under the same column is consistent. Tables with such a characteristic are called single-variable table, that is, the nature of the data is detemined by a single dimension (column).
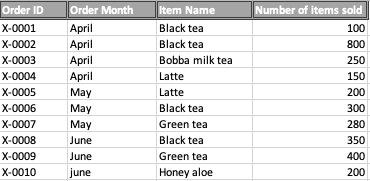
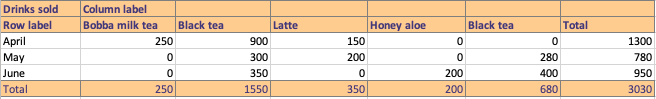
A table is called a cross table/ two-way/ two-variable table if the element of the data in a cell is determined bidimensionally (by vertical and horizontal header rows and fields). The table below is an example of a cross table, which is actually the pivot analysis result of the above table. In below cross table, each data in the cell is determined by both the column label and the month.
In principle, data analysis and advanced data processing are much more feasible in one-variable tabes than cross tables. Therefore, if you aim for a smooth data management in the long run, it is advised to store your raw data in one-variable tables. After the data is processed, storing them in cross tables would be a lot less likely to cause analytical or management problem.
A quick summary:
(1) Pre-processed (raw) data —> one-variable tables; processed data storage—> two-variable tables.
(2) If your data is stored in cross tables, they are most probably unsuitable for direct import to data management tools (like Ragic) due to format incompatibility. Likewise, it is not suggested to store data in cross tables if you are planning to conduct further analysis or processing, unless necessary.
By providing the above information, it doesn’t mean that you’re completely helpless if your data is stored in cross tables. You can simply adjust the format of your cross table using Excel’s Unpivot Transformation tool before importing it to Ragic. This tool can help convert your cross tables into a more suitable format (one-variable table) for data management and analysis.
Let's narrow down the concepts in this article to questions you can apply as preliminary identifications of whether or not your data format is pivot-analysis-friendly:
(1) Determine your table format:
- Is it or is it not a one-variable table? (No --> adjust)
(2) Identify its format organization:
- Does it have field header rows? (No --> adjust)
- Is there any empty rows, unevenly distributed or merged cells? (Yes --> adjust)
As a conclusion...
To attain a successful data management, the first thing you need to do is investigate the format and data placement logic that are suitable for your data: forms, spreadsheets, or other kinds of tables.
Next, determine whether or not you'd need to make adjustments, or what kind of adjustments you'd need to make based on your data management and analysis goals.
Do keep in mind that data in different formats (or elements) should not be directly merged or saved into one- because different formats serve different functions: spreadsheets for raw data storage, forms as an interface for filling out information, and pivot tables (cross tables) for data analysis results.
Now let's move on to the next part of the article!
Category: Tips and Tricks > Digital Tips and Tools

